PNMC Tracker View Chart Data
The purpose of this user guide is to demonstrate how to view chart data for providers.
After reviewing this user guide, you will be able to perform several tasks:
- View charts based on providers.
- Understand each chart’s meaning and use for tracking non-monetary compensation.
View charts that will sort by year, physician, total, and average compensation records.
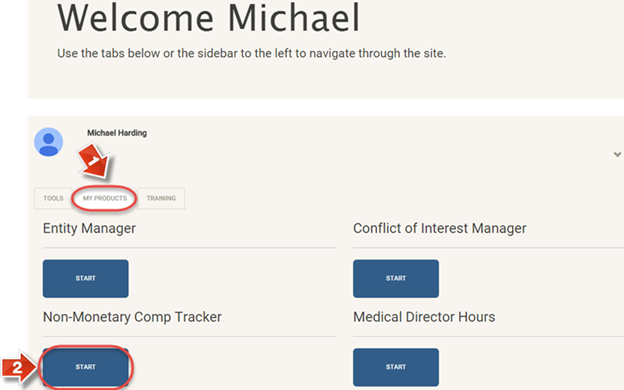
When you log in, on the Join the Endeavor Homepage go to the “My Products” tab (1) and access the “Physician Non-Monetary Compensation Tracker” (2).
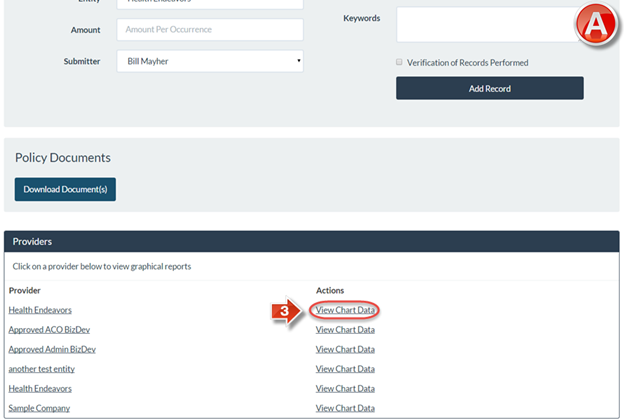
The “Comp Records” page (A) is the main page of the Physician Non-Monetary Compensation Tracker. Click the “View Chart Data” link (3) to view chart information related to a specific Entity.
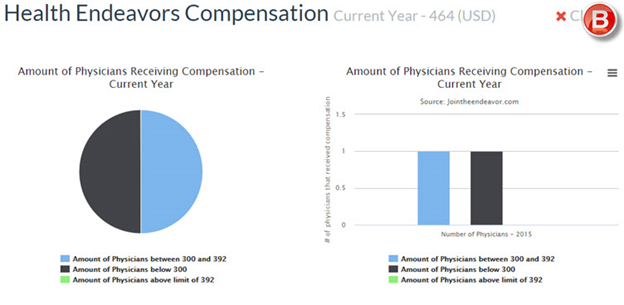
The compensation charts page (B) contains several different types of charts. The first type shows both a pie and bar graph of the current year’s compensation records. Each presents a separate section for physicians who are below $300 of the compensation limit, as well as sections for those who are between $300 and $392 and those who are over the $392 limit.
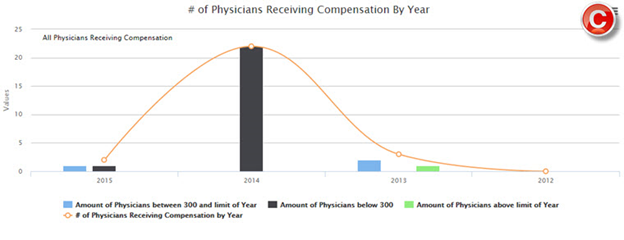
The next chart (C) shows the number of physicians receiving compensation from year to year as a line graph. Similar to the previous charts, there are separate sections for physicians under $300, between $300 and $392, and those over the $392 limit.
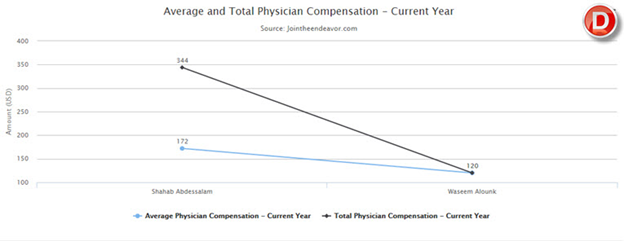
The next chart (D) shows the average and total physician compensation amounts for the current year. This shows the overall trend for the year, and presents an idea of what the average compensation amount is amongst all physician data.
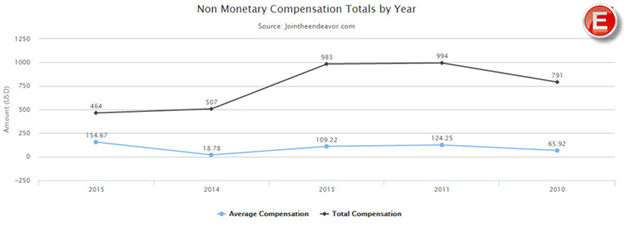
The final chart (E) shows both the total amount of non-monetary compensation amounts and the average compensation amounts for physicians from year to year. This is a general flow of both an average physician’s compensation amounts, and the total compensation amounts recorded to show trends from year to year.
