Run QM/GPRO Performance Report (QM Scoring)
Use the process outlined in this support article to generate a scorecard for either QM or GPRO.
Step-by-step guide
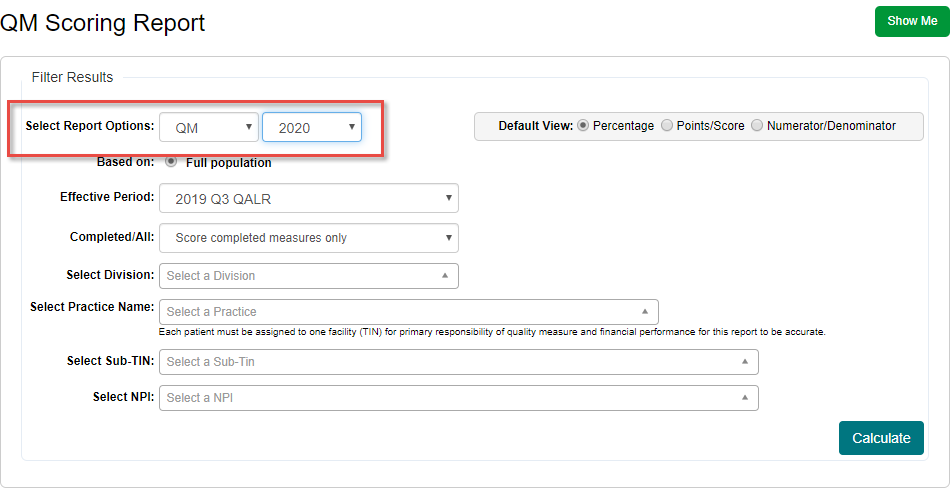
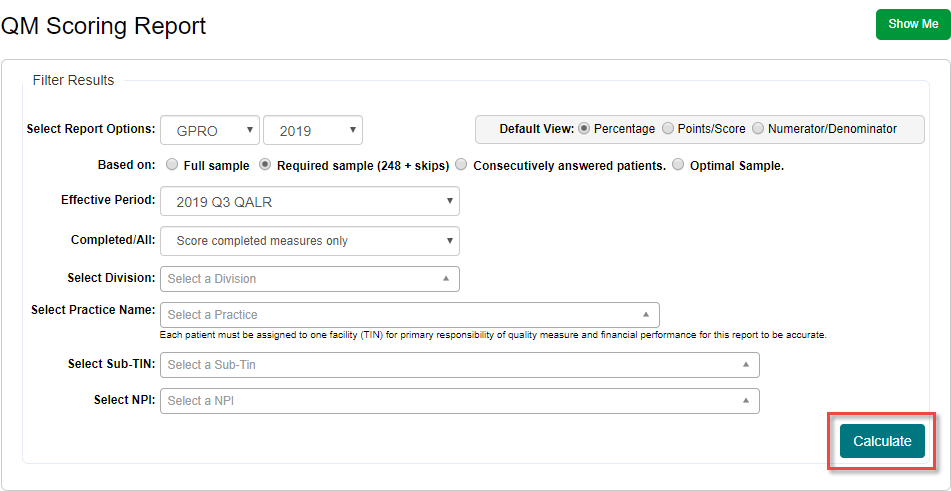
On the Scoring Report page, use Select Report Options to determine the period of time to run the report. Typically, the most recently available report will be selected by default, but you may switch between QM and GPRO, as well as performance years, by using the dropdown menus.
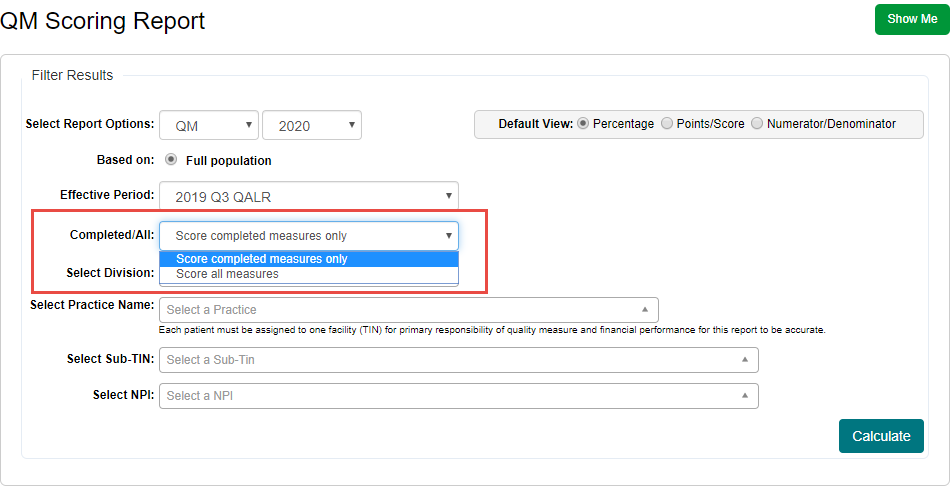
If QM is selected from the dropdown, it will always be based on the full patient population. However, you may choose to run the scoring report based on completed measures only, or based on all measures. Completed measures only will keep incomplete responses as incomplete. Score all measures, however, will score all incomplete responses as non-performance answers.
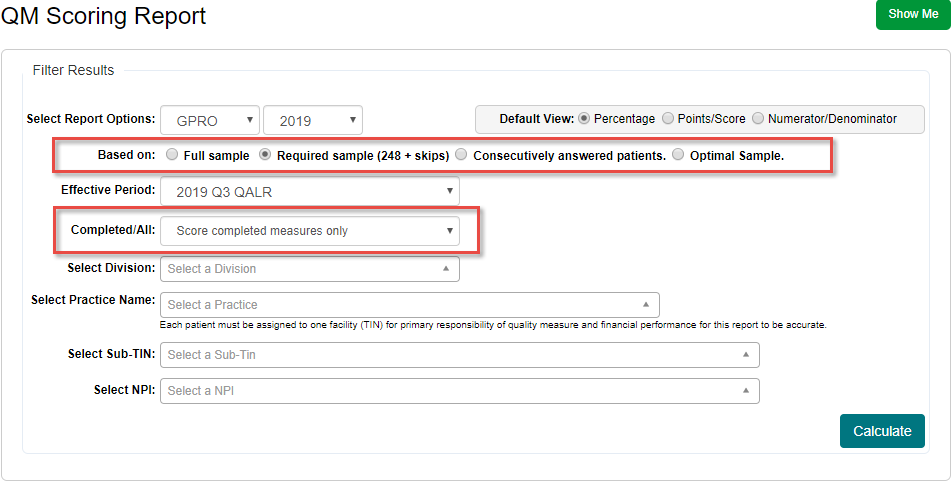
If GPRO is selected from the dropdown, you may choose to base the report on the Full sample, the minimum Required sample of 248 + skips, or based on Consecutively answered patients. Because some organizations may benefit more from being scored based on one of these methods, all three are available for use. As with the Competed/All options seen in step 3, you may also choose whether the report score is based on completed measures only, or based on all measures.
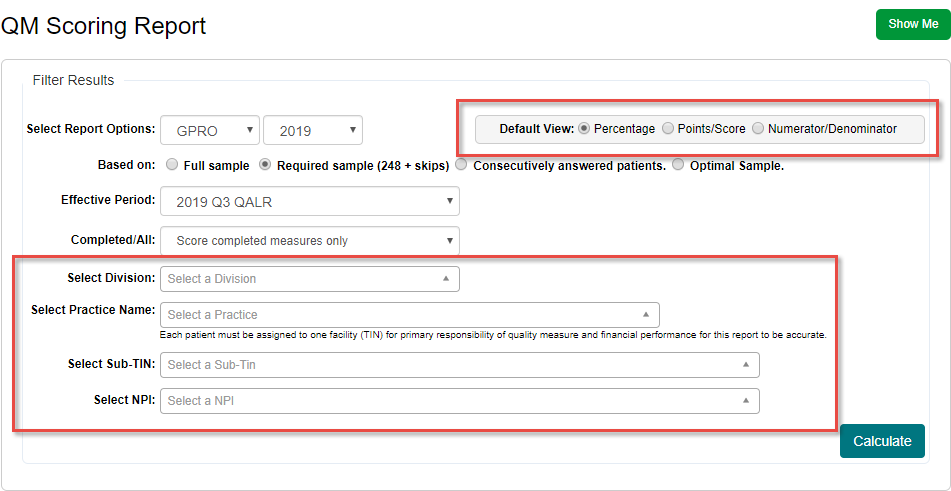
There are a number of other filter options to customize the performance report. Below is a list of the filters and the purpose of each one.
- Default View-This filter allows you to view your report based on Percentages, Points/Score, and Numerator/Denominator for each quality measure.
- Select Division – This filter will allow for the selection of a specific division, or multiple divisions within the ACO.
- Select Practice Name – This filter will allow the selection of a specific practice, or all practices in the ACO.
- Select Sub-TIN – This filter will allow for the selection of a specific Sub-TIN, or all Sub-TINs within the ACO.
- Select NPI – This Filter will allow for the selection of one specific National Provider Identifier, or all NPIs in the ACO.
After selecting the necessary filters to customize the report, click Calculate to run the report (You may also select the Excel Report to generate a spreadsheet of report data. Please be aware, however, that this report can take three to five minutes to generate.)
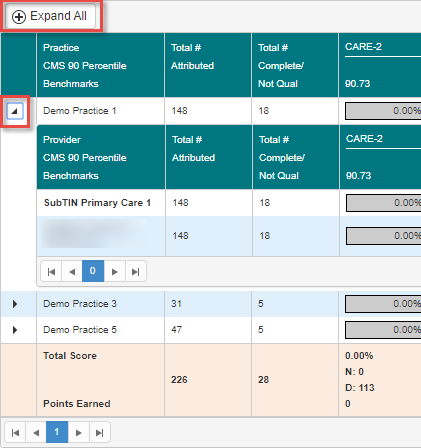
Narrowing down the view of the report, the far left shows practice-specific information, including Practice name and NPI, Total # of Attributed Patients, and Total # of Completed/Not Qualified Patients. This statistical information is useful for knowing the breakdown of patients based on practice, and relates to the overall total score farther to the right in the report. You may click a practice’s name to expand rows and show individual NPIs within the practice or you may click Expand All at the top of your report to show NPI’s for each practice.
Underneath each quality measure title in the blue bar, you will find the CMS percentile benchmarks listed underneath each quality measure title when available.
Your report will reflect different information depending on the default view you have selected. You will see your practices' scores in each measure based on Percentages, Points/Score, or Numerator/Denominator. For one specific measure you can alternate between these views by clicking desired field you would like to change.
The total score to the right of your report will also change depending on the default view selected. Your total score will be broken down into the following views;
- Points% - This will be calculated by dividing earned points by possible points.
- Points – This will show how many points you have earned for each measure.
- Average score - This is calculated by totaling the percentage score in each of the fourteen scored measures, then dividing by the total number of scored measures to find the average based on all scores.
At the bottom of the report you will see the following information totals across all listed practices:
- Total Score – This percentage is calculated by dividing each measure's numerator by the denominator.
- Numerator/Denominator – This will indicate the total of performance responses versus total applicable patients in the measure. The closer the numerator is to the denominator the higher your score will be.
- Points Earned – Shows the number of points earned per module. Depending on the percentile score for the ACO or Facility, this will be up to a maximum of 2 if the 90th percentile benchmark has been reached for the module.
- In the upper right corner of the report are additional options for exporting this scorecard and supplementary information:
More Information - Gives numerous tips and additional pointers on the reporting software and what each of the rows and columns mean. This information appears by hovering the mouse icon over this button.
Export Full Report - Moves the information presented in this performance report to a portable Excel spreadsheet. Includes all scoring information seen on-screen.
Export Percentage Report - Moves the information presented in this performance report to a portable Excel spreadsheet. Includes all relevant percentage scores.
Export Points Report - Moves the information presented in this performance report to a portable Excel spreadsheet. Includes all points earned from quality measures.
Export NUM/DEN Report - Moves the information presented in this performance report to a portable Excel spreadsheet. Includes all numerator/denominator scores.
Performance Scoring is available throughout the year, so it may be used to track progress, as well as scoring for your populations.
