GPRO Optimal Gaps Analysis Report
Use this report after you have completed the minimum required number of ranked patients in GPRO and would like to find out how to potentially optimize your score. This report works best with as much patient data filled in as possible in order to find the best number of ranked patients to submit to CMS for scoring.
Step-by-step guide
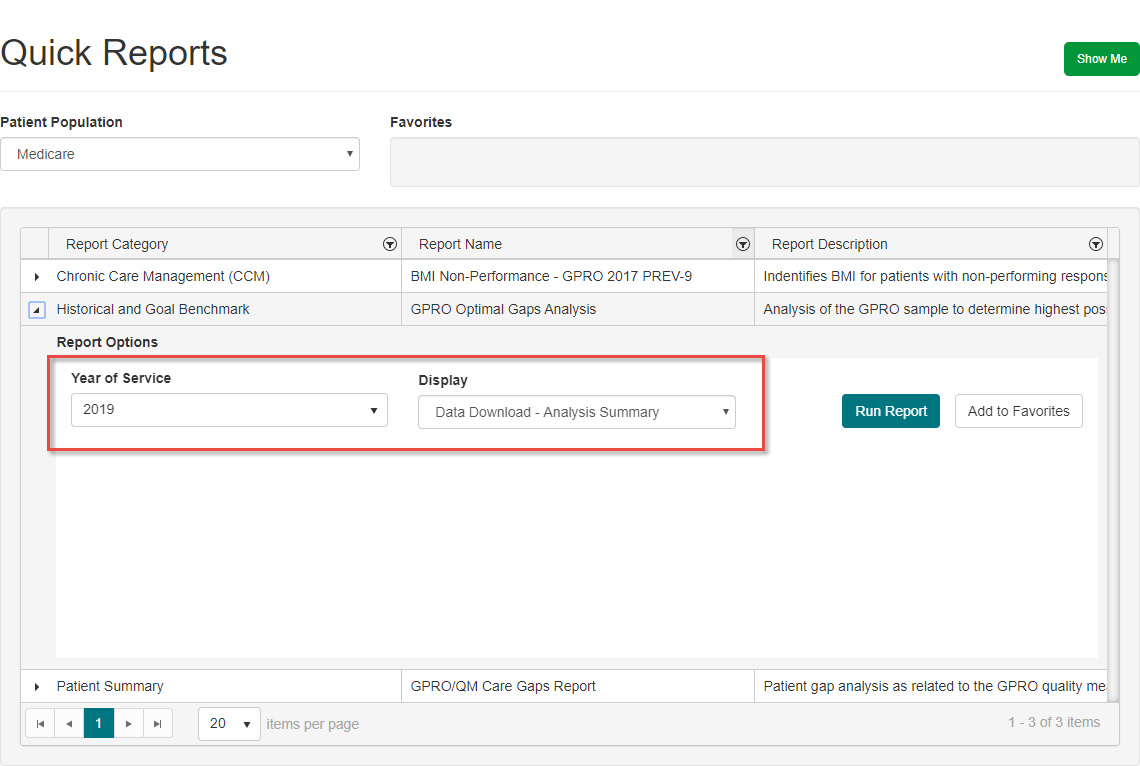
- In the Quick Data Tool, find the Optimal Gaps Analysis report. Be sure to select the Year of Service you would like to run if necessary (The current year is selected by default), and indicate in the Display dropdown whether you would like to see the Analysis Summary or Analysis Detail report.
Analysis Summary - A quick and straightforward report showing which of your measures have met the minimum requirements. For measures that have met the minimum, you will also see the recommended patient rank to report up to in order to potentially give you the highest score. Best for a quick look at quality measures and comparing what your score would be when submitting the minimum required versus a higher number of patient responses.
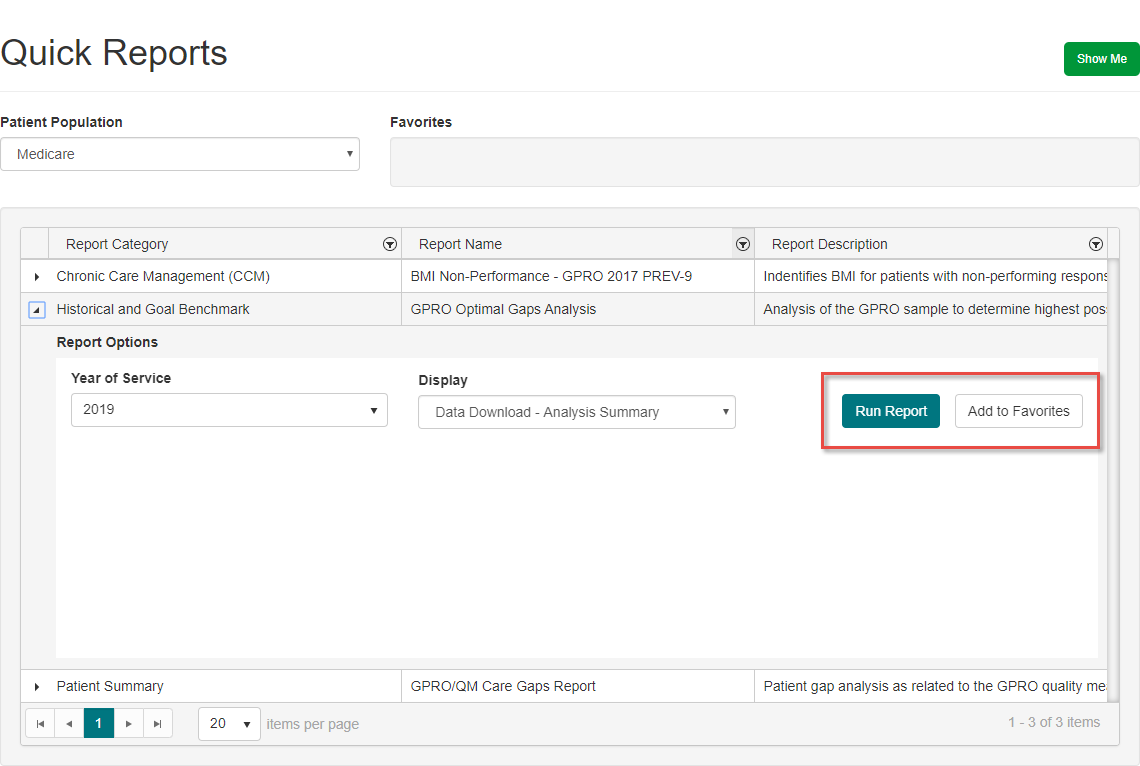
Analysis Detail - Shows all ranked patients, in order based on rank number for each measure, and shows how each ranked patient affects your overall percentage score. This shows a lot more information, but can still be used to find which ranked patient you should stop on in order to potentially yield the highest percentage score. Primarily used to showcase the range of potential percentage scores your organization can receive. - Click Run Report to download the analysis as an Excel spreadsheet. You may also click Add to Favorites if you would like to run this particular report more quickly in the future.
- There are three primary sections in the Analysis Summary report. The first section lists all quality measures, and indicates whether or not your organization has met the minimum ranked sample. If a measure has not met the minimum required sample, you will not be able to look at optimization information. In addition, if all patients are required to satisfy any of the modules (Less than the normal minimum ranked sample), you will not see optimization information since all patients are required for reporting. An example of this is presented below in the row for PREV-13.
- The next section summarizes your organization's current minimum completed sample information, including overall percentage score for each module. Please note: If any of the quality measures have not been completed up to the minimum required sample, you should not use this report for gathering information on these modules. This report is only intended for use with quality measures that have already met the minimum sample requirements.
- The third section summarizes, based on all present response data, how many ranked patients should be submitted to CMS in order to potentially increase your organization's overall score for each module. In other words, the optimal rank at which to stop sending successive patient response data to present the best possible percentage score, and what that score will be. (If any measures have not yet been completed, then the values in that measure's row will be completely blank as in the example for PREV-13 seen previously.)
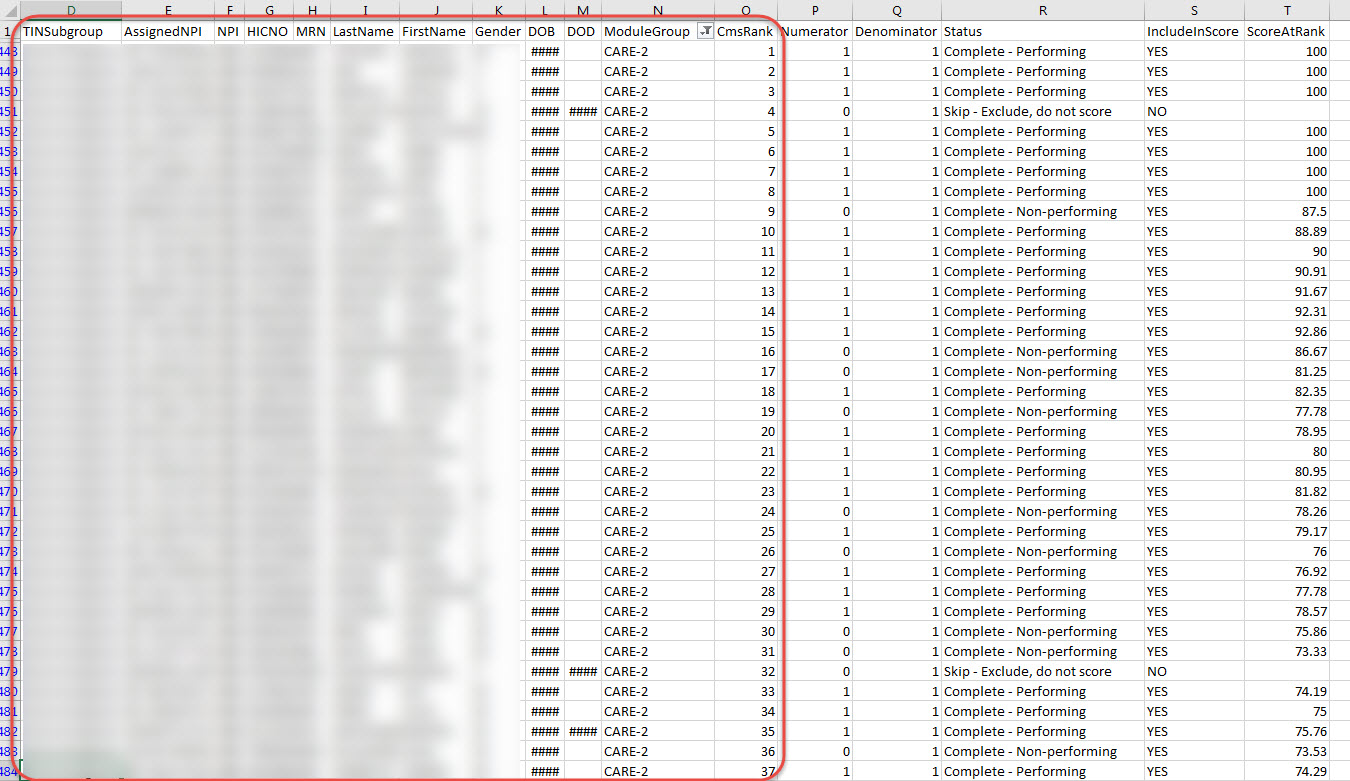
- There are two primary sections in the Analysis Detail Report. The first section shows patient information, including ranked modules and rank number for each module. In particular, it is useful to add a data filter to the ModuleGroup column in order to view only patients ranked in a specific quality measure.
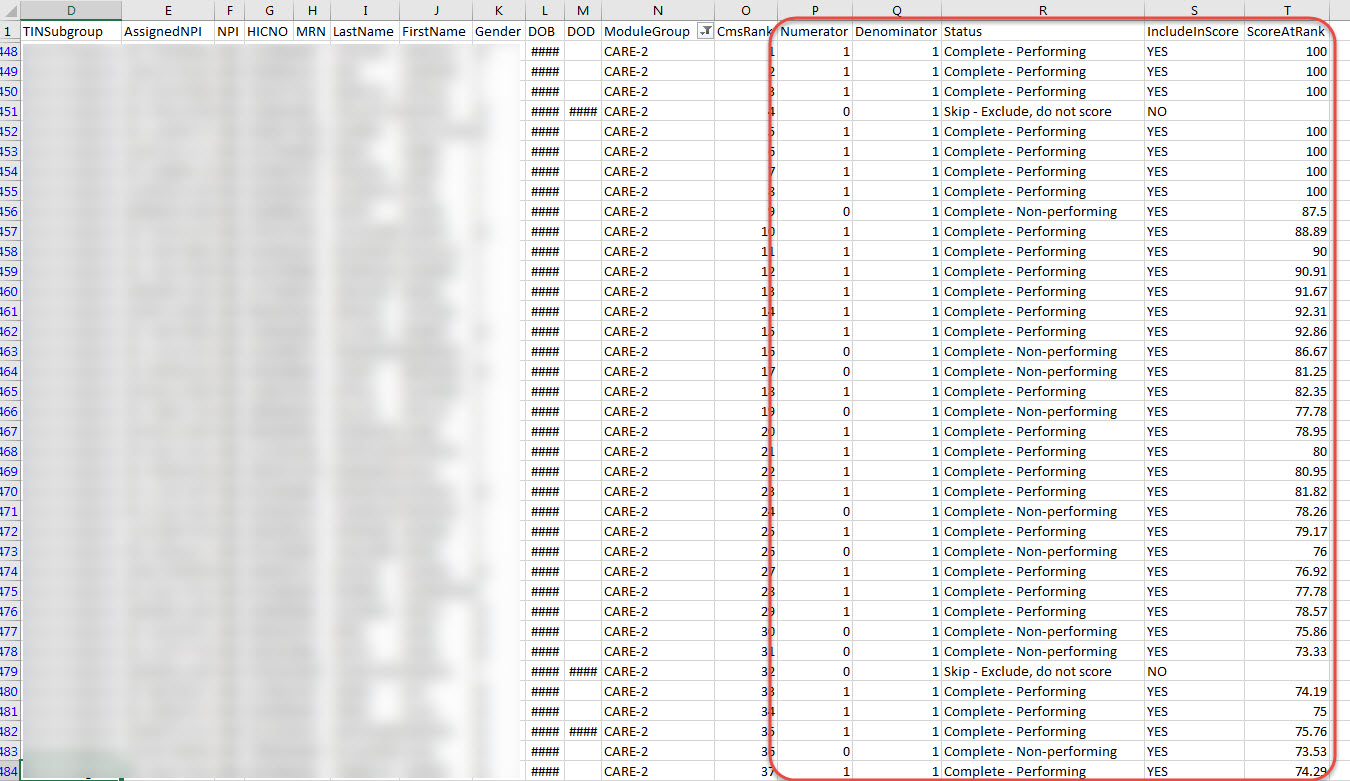
- The second section shows each patient's completion status, scoring, and how this outcome affects your organization's overall score for this measure. This percentage score may rise and fall depending on each patient's scoring. By filtering the ScoreAtRank column, you may find where the best percentage score is for each measure. Please note, however, that you should begin to look for this score in rankings higher than the minimum required to satisfy the module.


